Case Study — Python · Testing · Developer Experience
My test suite took 19 minutes. Now it takes 32 seconds.
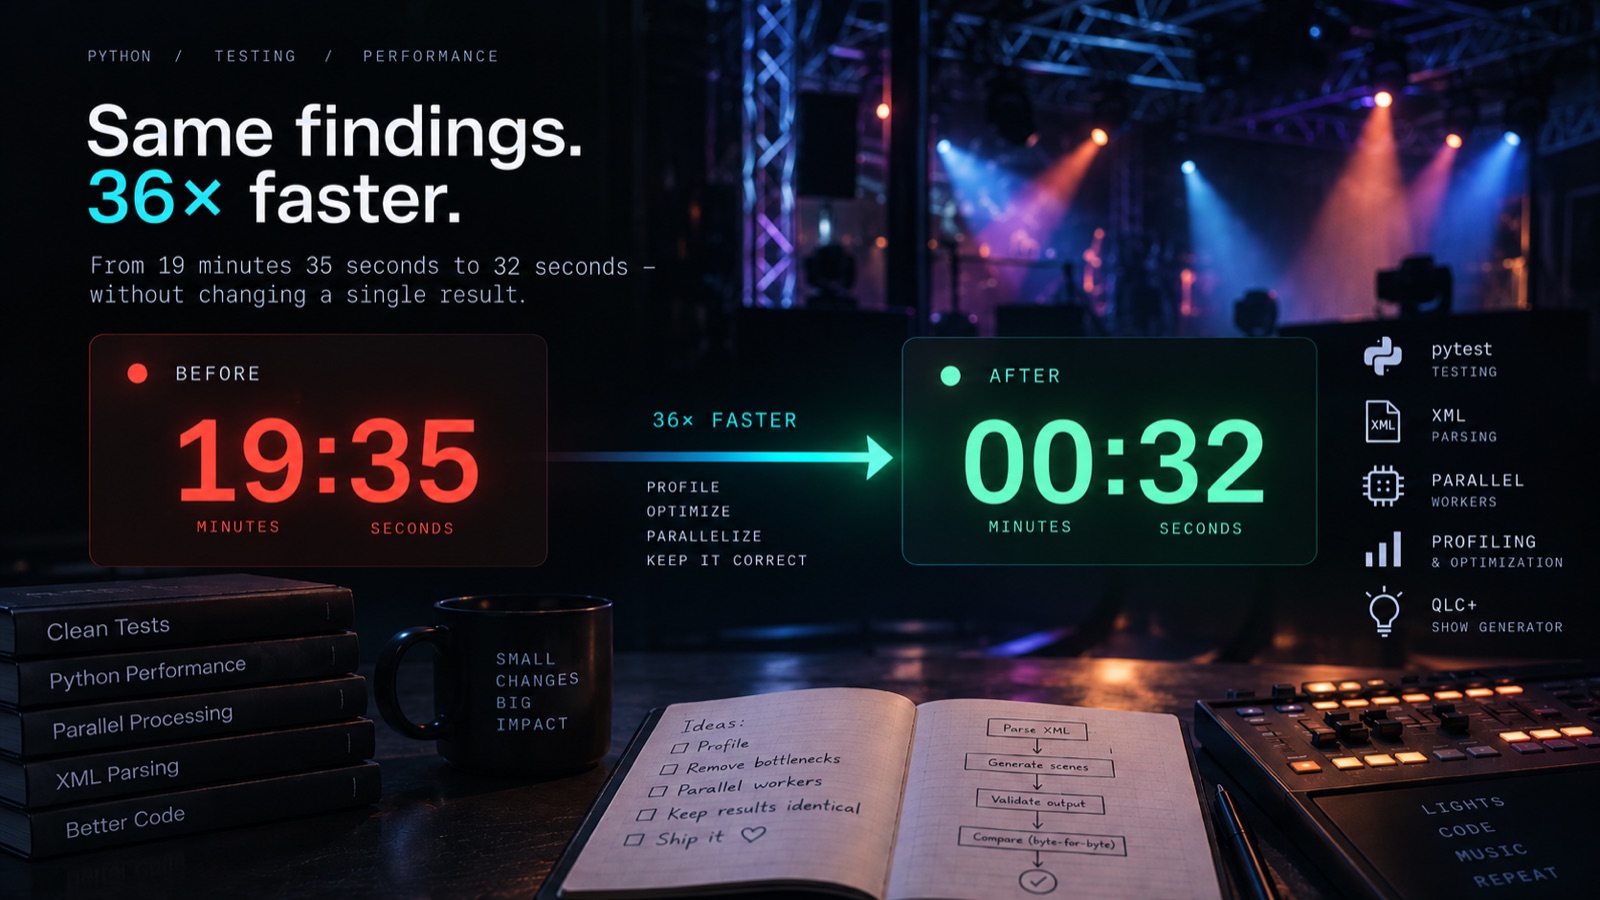
A 463-test suite for a lighting-show generator went from 19 minutes to 32 seconds in the September 22, 2026 runs, with unchanged findings on the comparison fixtures. One profile, one cache, one lock, and a budget gate that turns red if it ever creeps back. Development is faster because the feedback is faster.
- Python
- pytest
- pytest-xdist
- cProfile
- lxml
- flock
- QLC+
- codeality
Nobody stops to look at the tests
My test suite took 19 minutes. Every run was green, so nobody looked at it. That is the whole problem with a slow suite: it never fails, it just quietly teaches everyone to run it less. The recorded full run took 1,175 seconds before the optimization.
The project is a generator for a nightclub's lighting show: a Python tool that writes QLC+ workspaces and then checks them with about sixty rules, so that a button on the console does what its label promises before anyone stands in the room. The checker is the interesting part: 462 tests, and 94 of them run the whole rule set over a real show. One night I said out loud that 19 minutes was absurd, and then measured instead of guessing.
Where the time went
pytest --durations=25 said that one pass of the checker cost 11.5 seconds. Times 94 passes, that was 18 of the 19 minutes. Three rules paid 9.4 of those 11.5 seconds. Under cProfile the reason was one line: a helper that parses a scene's channel values was called 620,951 times per pass. The same scenes, parsed again and again, because each rule built a fresh evaluator per call and each evaluator parsed everything from scratch.
Nothing in that was hard. It was just never looked at, because green.
Four steps, each one measured
- Parse each leaf once. The show graph is immutable while it is checked, so the parsed values now live on the graph, and the rules share one evaluator each. One pass: 11.5 s to 2.0 s. Suite: 1,175 s to 241 s.
- Walk the XML in C. A second profile showed 2.7 million calls to a Python function that compared local tag names, because every find was a Python loop over children. lxml's {*}name wildcard does the same match in C. That, plus memoizing the graph's reachability and a few per-fixture lookups, took a pass to 0.83 s. Suite: 138 s.
- Prove nothing changed. Before either step I dumped every finding the checker produced on the three shipped shows and on two deliberately broken ones, as JSON. After each step, diff said identical. A speed-up that changes one finding is a bug with a good excuse.
- Then parallelize. pytest-xdist with -n auto: 46.8 s on four workers, 32.4 s on twelve. Parallel was the last step on purpose. It multiplies whatever problem is there, and it hides the one you have not found.
The bug parallel found before CI did
The suite also launches the real QLC+ application to check that generated files load. I measured nine launches when tuning its wait time. That build writes its debug log to one hard-coded file in the home directory, in append mode. Two validations started together truncate each other's log, and whichever reads last inherits the other's session. I wrote that as a test first, validating the real show and a truncated one from two threads, and it failed three runs out of three: the real show inherited "fixture 13 overlapping" from the other validation. Then I added an flock around the launch, in the validator itself rather than in the tests, so any caller is serialized without knowing. Three out of three green. That test is the 463rd.
Same file, one more thing: the validator waited two seconds of log silence before deciding the load was done. Nine launches with a stopwatch said every complaint lands within 20 ms of the "loaded" marker and the log stops growing 0.2 s after it. Two seconds became one, with a fivefold margin, and I know the margin because I measured it rather than because it felt safe.
What changed in practice
- I run the whole suite without thinking about it now. At 19 minutes it was a decision; at 32 seconds it is a reflex.
- The September 23 quality-gate run completed its pytest stage in 37 seconds. The gate reports the ten slowest tests on every run, so the next slow test is visible the day it lands.
- A budget gate turns red if the suite ever creeps back past 2 minutes. A one-time fix is a story; the thing that keeps it fixed is a gate that fails.
- Development is faster because the feedback is faster. That is the whole story.
Making it a rule, not a story
I shipped the lesson into the quality tooling I maintain for my projects, codeality-py 0.2.3: a test-budget-seconds key, and a pytest stage that reports over-budget when the suite passes but takes longer than that. It exits like any other finding, and the detail carries the slowest-test table, because pytest now runs with --durations=10 on every gate run. New projects get pytest-xdist and -n auto from their first test, so a suite is written isolated instead of retrofitted. The lighting project's budget is 120 seconds.
The standard that goes with it, for both Python and TypeScript, is seven steps in order: profile one slow test, memoize on the immutable input, do the walk in the runtime instead of the language, prove identical output, parallelize, lock what must stay shared in the code that uses it, and shorten waits on measurement never on hope. One false positive to know about: the same suite measured 240 s and 331 s within an hour on a machine at load 25. Read the number with uptime next to it before profiling anything.
Where to check it
- The standard and the gate are public at github.com/syntopica/codeality: docs/standards/testing.md and packages/codeality-py. The lighting project is public at github.com/Vibra-Lab/vibra-lighting; the numbers above are from its work log, dated 2026-09-22 and 2026-09-23.
- Unchanged by design: the checker's findings, byte for byte, on the three shows compared in that run.
- The work log records the optimization on September 22 and the budget gate on September 23, 2026.